Human-computer interaction technology in virtual reality - Steady-state visual evoked potential - Dr
2021-11-15
1. The introduction
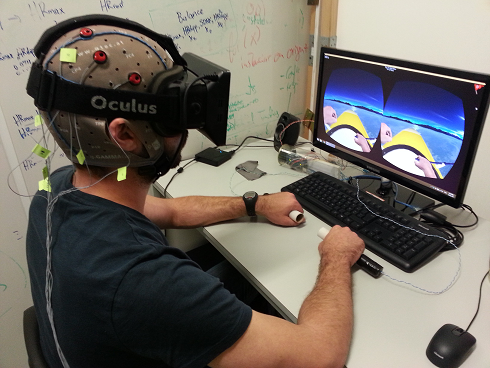
Virtual reality interaction technology based on brain computer interface provides a new interaction mode for users. Users can directly control virtual environment objects through brain information without using peripheral input devices such as handles and keyboards, which greatly improves users' immersive experience. The current brain-computer interface technology can be divided into three main categories: steady-state visual evoked potential based brain-computer interface, event-evoked potential based brain-computer interface and motor intentional-imagination based brain-computer interface. This paper mainly introduces the brain-computer interface technology based on steady-state visual evoked potential, including the generation principle of steady-state visual evoked potential, stimulation mode and frequency detection technology.
2. Principle of steady-state visual evoked potential
Evoked potential mainly has visual evoked potential, auditory evoked potential and tactile evoked potential three kinds. Visual evoked potentials (VPS) are widely used in the study of eeg because of their simplicity and convenience. When the vision is stimulated by light or graphic flashing, the Potential of eeg signals will change, and these Potential changes are Visual Evoked Potential (VEP).
Visual evoked potentials can be broadly divided into three categories: Transient Visual Evoked Potential (TVEP), steady-state Visual Evoked Potential (SSVEP) and pseudo-random code Visual Evoked Potential. SSVEP signal has high signal-to-noise ratio, signal concentration and stable spectrum, so it has been widely studied in cognitive and clinical applications. Compared with other types of BCI systems, THE BCI system based on SSVEP signals has higher classification accuracy and faster information transmission rate, and can also work in asynchronous mode. Therefore, SSVEP signal is widely used in brain-computer interface system and eeg signal research.
When human body is a fixed frequency blinking or transform mode of visual stimulation, electrical activity of the cerebral cortex will be modulation, to produce a continuous and related to stimulus frequency (stimulus frequency fundamental frequency or frequency doubling) response, the response are of a similar cyclical rhythms, and visual stimulation is the steady-state visual evoked potential (SSVEP). The SSVEP signal in the EEG signal is the peak in the power spectrum at the stimulus frequency or harmonics. By analyzing the frequency corresponding to the peak of the detection spectrum, the stimulus source of the subject's visual gaze can be detected, and the subject's intention can be identified.

Figure 1 Virtual reality interaction technology based on brain computer interface
3. Steady-state visual evoked potential stimulation
Visual stimuli that induce SSVEP signal mainly include optical stimuli, graphic stimuli and pattern reversal stimuli. Optical stimulation source is mainly used by a certain frequency modulation LED, fluorescent lamp, xenon lamp and other light sources as visual stimulation. The light source stimulator generally contains an accurate circuit control system, through which a variety of flicker modes at different frequencies can be produced. Graphic stimulus sources mainly use computer to display screen flashing stimulus, that is, make a single simple square, complex multiple squares, pictures of different colors and other graphics, and the graphics flashing stimulus at a certain frequency. The mode flipping stimulus is also generated on the display screen. The difference is that the mode flipping stimulus mainly uses two graphics to appear alternately at a certain flipping rate to show the visual stimulus. At present, the commonly used graphics modes are black and white checkerboard and grid. Among the three stimulus sources introduced above, the optical stimulus can produce an exact arbitrary frequency, while the graphic scintillation stimulus and pattern reversal stimulus can only produce a limited precise frequency due to the limitation of the computer display refresh frequency, and the maximum frequency can be produced is not higher than half of the computer display refresh frequency. However, graph flicker stimulus and pattern reversal stimulus are generated by software code, so it is very convenient to make a variety of different graphics, different colors, different layouts, different numbers of stimulus graphics. It is relatively inconvenient for a photostimulus to change the way it is stimulated.
In general, SSVEP signals can be induced when the stimulus frequency is between 1-100Hz. In the brain-computer interface system based on steady-state visual evoked potential, the frequency range of stimulation is usually 4-50Hz, in which the stimulation frequency of 1-12Hz is called the low frequency band, the stimulation frequency of 12-30Hz is the middle frequency band, and the stimulation frequency of 30-50Hz is the high frequency band. When the stimulus frequency was 10Hz, SSVEP produced the maximum response. Secondly, the stimulus frequency that can obviously induce SSVEP signal is concentrated in the middle frequency band, while the stimulus frequency of high frequency band can induce the least response. Since the SSVEP signal induced by the stimulus frequency in the middle and low frequency band can generate a large response, the current brain-computer interface system based on steady-state visual evoked potential adopts the stimulus frequency band mainly in the middle and low frequency band (4-30Hz). However, the stimulus frequency of this frequency band also has some disadvantages. First, the visual stimulus source flashing at this frequency band is more likely to cause visual fatigue; Secondly, when the stimulus frequency of visual stimulus source is in this frequency band, it is easy for subjects to induce epilepsy, especially when the stimulus source flickers at 15-25Hz frequency. Finally, the frequencies of α band and β band of human spontaneous brainwave are 8-13Hz and 13-30Hz respectively, which will overlap with the stimulation frequency of this frequency band, thus causing error detection. Although there are many disadvantages in the middle and low frequency band, this band can produce the maximum response of the SSVEP signal, and these disadvantages can be solved by enhancing the SSVEP signal energy.
4. Steady state visual evoked potential frequency detection method
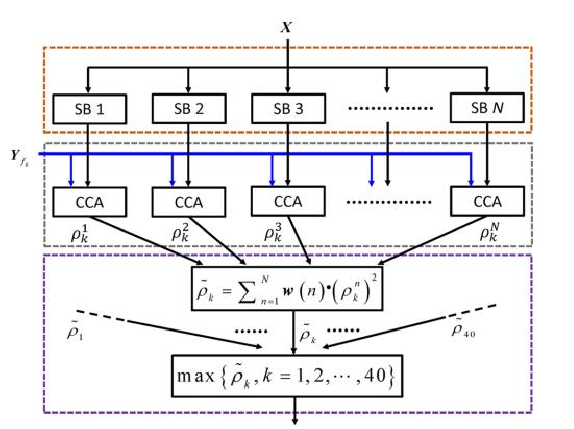
In recent years, canonical Correlation analysis (CCA) algorithm has been widely used for frequency recognition in BCI based on SSVEP due to its high efficiency, robustness and simple implementation. At the same time, many researchers have made improvements on the basis of CCA to improve detection performance. Among them, filter Bank Canonical Correlation analysis (FBCCA) effectively utilizes the fundamental and harmonic components of SSVEP signals, and significantly improves the recognition accuracy of SSVEP. The SSVEP signal is decomposed into several subband components by a filter bank composed of several bandpass filters, thus the valuable information of SSVEP signal harmonic component is extracted. As shown in figure 2, the realization of FBCCA algorithm is mainly divided into three steps :(1) the decomposition of brain telecommunication subbands; (2) Correlation analysis between each subband signal and each frequency reference signal; (3) Obtain the characteristics of the maximum correlation coefficient and identify it.

FIG. 2 Block diagram of FBCCA algorithm
CCA is a multivariate statistical method to analyze the potential correlation between two sets of data. It was first applied to frequency identification of BCI based on SSVEP in 2007 and achieved a good recognition effect. In CCA, for two sets of signals X and Y, when their correlation reaches the maximum, the corresponding linear combination can be calculated and recorded as typical variables X and Y, as shown in Equation (1) :
 (1)
(1)
Where, m is the dimension of variable X and L is the dimension of variable Y. Among them, the correlation coefficient ρ between X and Y corresponding to the linear combination of two sets of signals X and Y is calculated as shown in Equation (2) :
 (2)
(2)
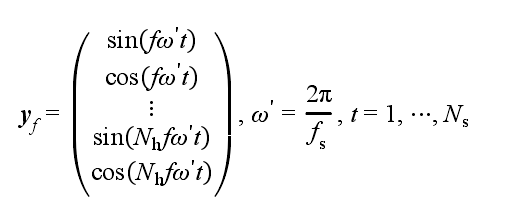
In SSVEP frequency detection, the eeg signal is XEEG and the reference signal is YF. The reference signal Yf corresponding to the stimulus frequency f is shown in Equation (3) :
 (3)
(3)
Where, Nh is the number of harmonics, FS is the sampling rate, Ns is the number of sampling points. The correlation coefficient between XEEG and the reference signal YF corresponding to each stimulus frequency was calculated by Formula (2). A typical correlation coefficient (maximum correlation coefficient) could be obtained for each stimulus frequency. These correlation coefficients were compared and the reference signal frequency corresponding to the maximum value was denoted as SSVEP stimulus frequency.
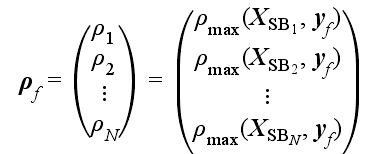
FBCCA algorithm is optimized on the basis of CCA method. The EEG signal is decomposed into multiple subbands through bandpass filter, and then CCA is used for frequency recognition. Firstly, the eeg signal XEEG is decomposed into a certain number of subband signals XSBi (I =1... N, where N is the number of subbands) by using several bandpass filters in the filter bank. In the second step, for the reference signal yf corresponding to the stimulus frequency F, the N subband signal XSBi is analyzed with CCA respectively, and then the N maximum subcorrelation coefficient ρ I (I =1... N) is obtained, so the correlation coefficient vector ρf is obtained. ρf consists of all ρ I, and its calculation formula is shown in Equation (4) :
 (4)
(4)
The third step is to square the N sub-correlation coefficient ρ I in the correlation coefficient vector ρ F, and then sum to obtain the target recognition feature, namely the total correlation coefficient F, as shown in Equation (5) :
 (5)
(5)
Where, a and b are constants. In this way, for each reference signal yF corresponding to the stimulus frequency, its total correlation coefficient f with the EEG signal XEEG was calculated. The maximum total correlation coefficient f is denoted as the frequency of SSVEP stimulus.
